In SQL Server, you can use the SET SHOWPLAN_ALL statement to return detailed information about how a T-SQL statement is executed, as well as estimates of the resource requirements for the statements.
SHOWPLAN_ALL returns information as a set of rows that form a hierarchical tree representing the steps taken by the SQL Server query processor as it executes each statement. It’s similar to SHOWPLAN_TEXT, except that SHOWPLAN_ALL returns more detailed information (and is intended to be used with applications that can handle its output).
You can set SHOWPLAN_ALL to either ON or OFF.
When SHOWPLAN_ALL is ON, all subsequent T-SQL statements are not executed. Instead SQL Server returns execution information for the statement (without executing it).
It’s important to note that SHOWPLAN_ALL provides estimates of the resource requirements, and that actual resource requirements may differ when the statement is in fact executed.
Example
Here’s an example to demonstrate.
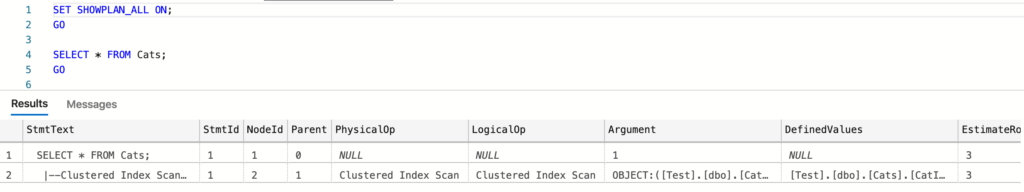
SET SHOWPLAN_ALL ON;
GO

SELECT * FROM Cats;
GO
Note that SET SHOWPLAN_ALL cannot be specified inside a stored procedure, and it must be the only statement in a batch.
Here’s what the result looks like in Azure Data Studio:
And here’s what it looks like in mssql-cli (command line interface) when using vertical output:
Commands completed successfully.
-[ RECORD 1 ]-------------------------
StmtText           |
SELECT * FROM Cats;
StmtId             | 1
NodeId             | 1
Parent             | 0
PhysicalOp         | NULL
LogicalOp          | NULL
Argument           | 1
DefinedValues      | NULL
EstimateRows       | 3
EstimateIO         | NULL
EstimateCPU        | NULL
AvgRowSize         | NULL
TotalSubtreeCost   | 0.0032853
OutputList         | NULL
Warnings           | NULL
Type               | SELECT
Parallel           | 0
EstimateExecutions | NULL
-[ RECORD 2 ]-------------------------
StmtText           |   |--Clustered Index Scan(OBJECT:([Test].[dbo].[Cats].[PK__Cats__6A1C8AFAB3EF1A8F]))
StmtId             | 1
NodeId             | 2
Parent             | 1
PhysicalOp         | Clustered Index Scan
LogicalOp          | Clustered Index Scan
Argument           | OBJECT:([Test].[dbo].[Cats].[PK__Cats__6A1C8AFAB3EF1A8F])
DefinedValues      | [Test].[dbo].[Cats].[CatId], [Test].[dbo].[Cats].[CatName]
EstimateRows       | 3
EstimateIO         | 0.003125
EstimateCPU        | 0.0001603
AvgRowSize         | 142
TotalSubtreeCost   | 0.0032853
OutputList         | [Test].[dbo].[Cats].[CatId], [Test].[dbo].[Cats].[CatName]
Warnings           | NULL
Type               | PLAN_ROW
Parallel           | 0
EstimateExecutions | 1
(2 rows affected)
Commands completed successfully.
There are a lot of columns, so I used vertical output here so that it makes it easier to read.
If my query was more complex, more rows would be returned.
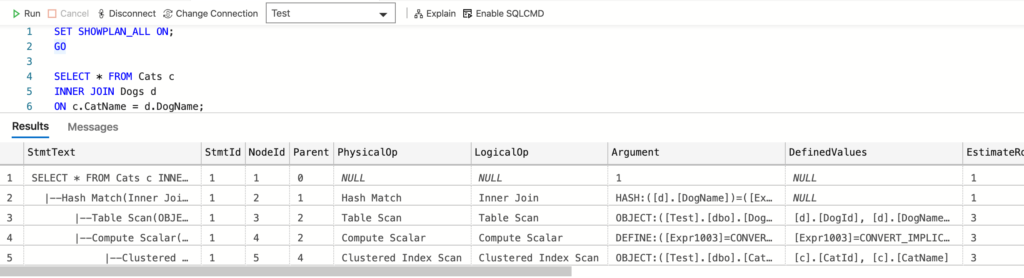
Here’s an example of a (slightly) more complex query.
SELECT * FROM Cats c
INNER JOIN Dogs d
ON c.CatName = d.DogName;
Result:
How to Turn it Off
You can turn it off by using SET SHOWPLAN_ALL OFF.
Once you’ve done this, subsequent statements will execute as normal.
SET SHOWPLAN_ALL OFF;
GO

SELECT * FROM Cats;
GO
Result:
Commands completed successfully.
+---------+-----------+
| CatId   | CatName   |
|---------+-----------|
| 1       | Meow      |
| 2       | Fluffy    |
| 3       | Scratch   |
+---------+-----------+
(3 rows affected)
Commands completed successfully.
Deprecated or Not?
According to this old MSDN article, SET SHOWPLAN_ALL is scheduled for deprecation in future showplan versions, and it is recommended that you use SET SHOWPLAN_XML instead.
However, that MSDN article is for SQL Server 2008 R2, and as I write this, it doesn’t seem to have been deprecated in SQL Server 2019. In fact, the current documentation makes no mention of deprecation, and it isn’t included when I run a list of deprecated items in SQL Server.
Either way, it probably pays to bear this in mind before using it in future releases.
Graphical Execution Plan
If you’re using a graphical tool such as SSMS or Azure Data Studio, you might have the option to view the estimated graphical query execution plan for the current query.
- In SSMS you can use Ctrl + L to do this. Or you can click the Display Estimated Execution Plan icon, or right-click in the query window and select Display Estimated Execution Plan.
- In Azure Data Studio, you can click the Explain button above the query window.
You can also use SET SHOWPLAN_XML ON to enable it, and SET SHOWPLAN_XML OFF to disable it.