If you use Azure Data Studio for your database admin tasks, you might be wondering how you can view the execution plan for your queries?
Fortunately, this is easy!
You have the option of viewing:
- An estimated query execution plan
- The actual query execution plan
Estimated Query Plan
The estimated query execution plan shows you an estimation of what the query plan would look like if you were to run it. It does this without actually running the query.
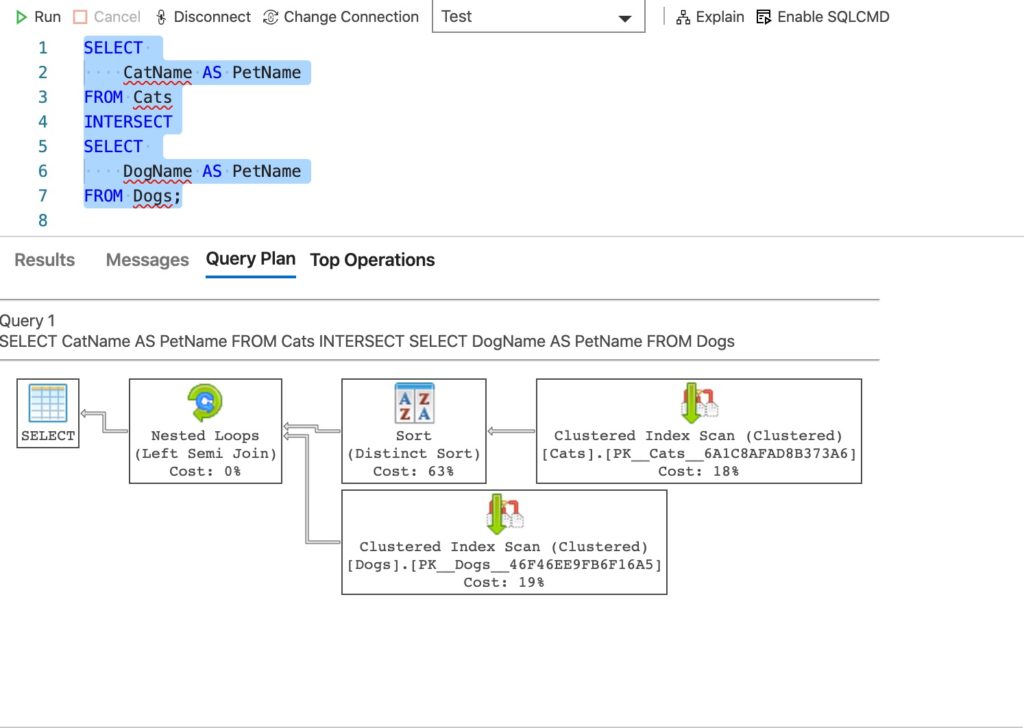
To view the estimated query plan in Azure Data Studio, simply click on the Explain button at the top of your query tab.
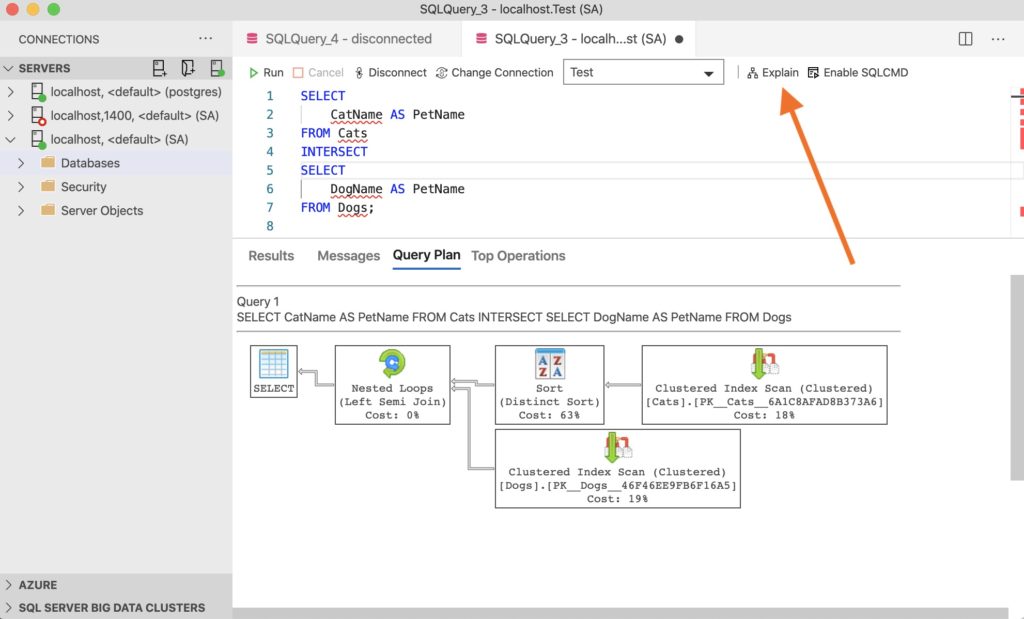
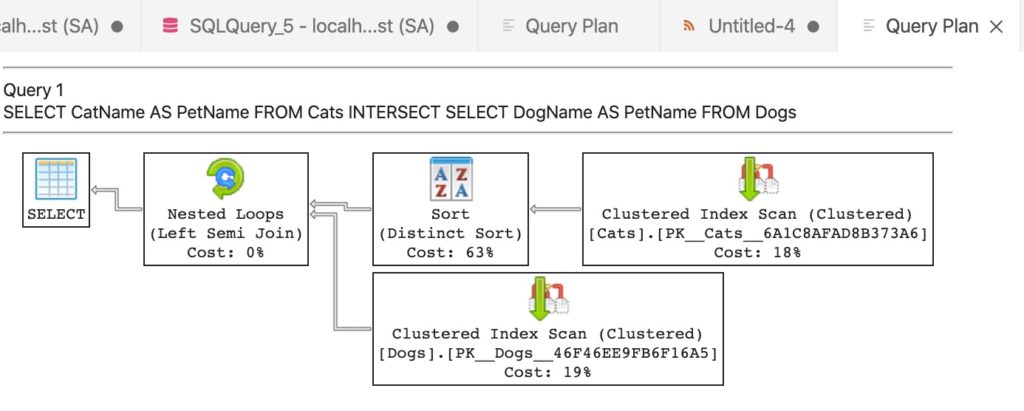
Clicking Explain will automatically display the query execution plan in the bottom pane.
We can tell that this is only an estimated query plan when we click on the Top Operations tab.
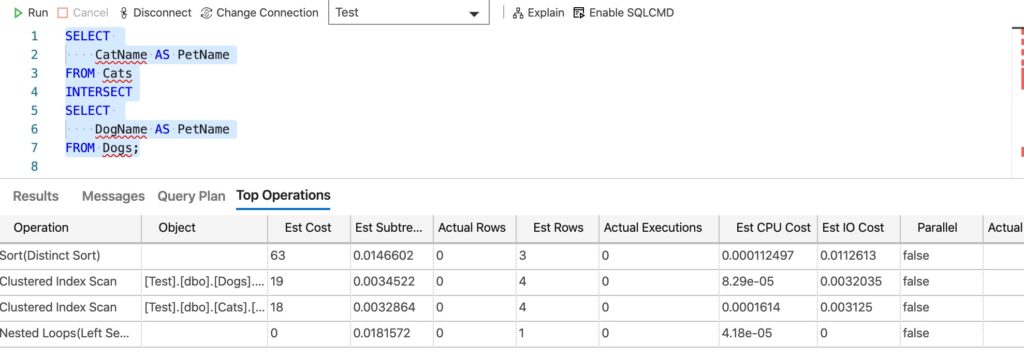
We can see that the Actual Rows and Actual Executions columns contain zeros, while the Est Cost, Est Subtree Cost, and Est Rows are filled with nonzero data.
If your query tab contains multiple statements but you only want the query plan for one, you can highlight that statement (just like when you highlight one when you only want to execute that statement).
Actual Query Plan
To get the actual query execution plan, you need to run the actual query with the query plan.
To do this, open a tab and write your query (or highlight the query if it’s sitting amongst other queries on the same tab).
Now go to View > Command Palette…
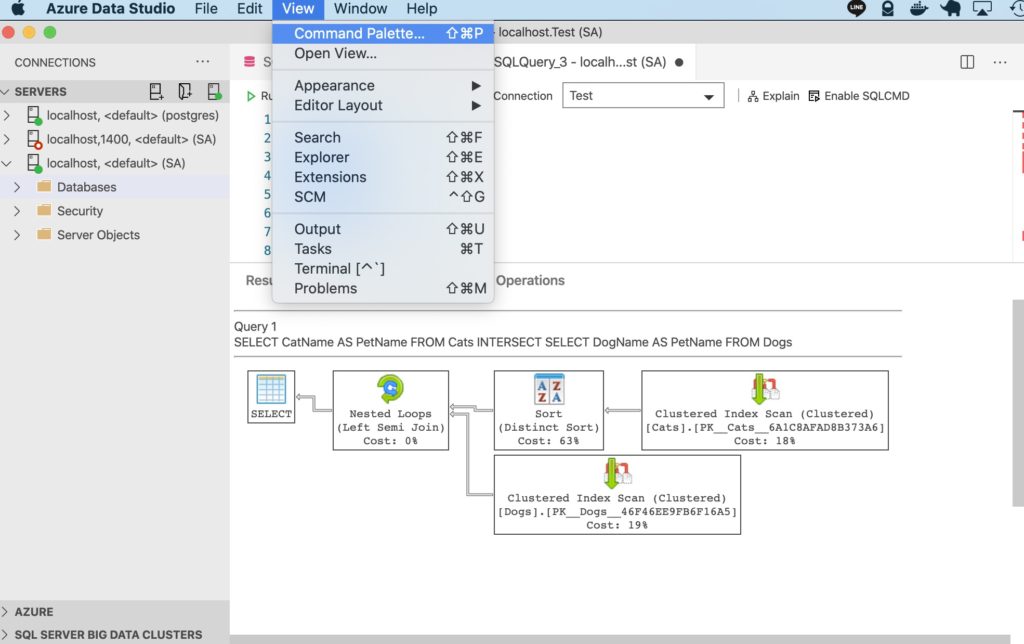
And then type Run Current Query with Actual Plan and click on the same text that should now appear.
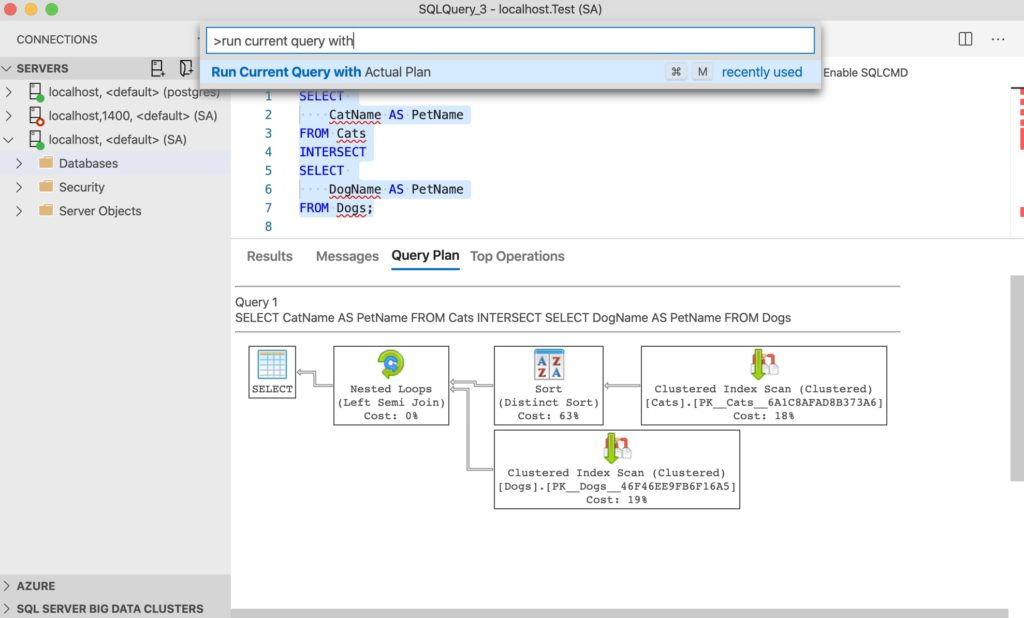
It will now run the query with the actual query execution plan.
In my case the actual execution plan looks the same as the estimated one:
But when I click on the Top Operations tab, it’s a different story:
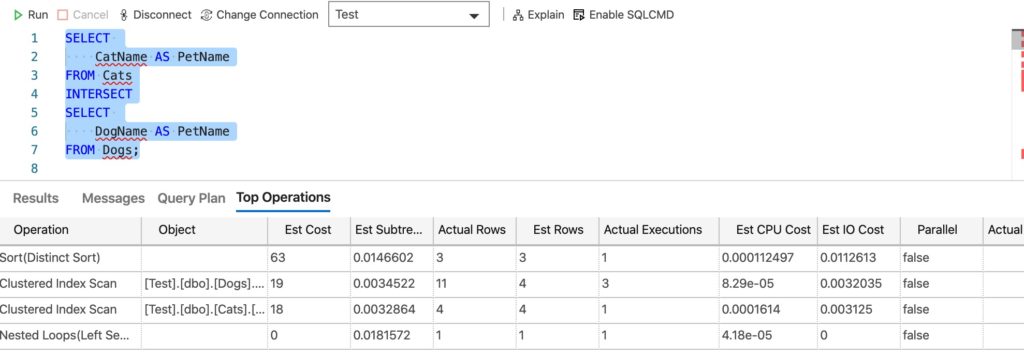
I can now see that the Actual Rows and Actual Executions contain actual data (as opposed to the zeros that were in the estimated query plan).
XML Format
You can click on the Results tab to get an XML representation of the query plan.
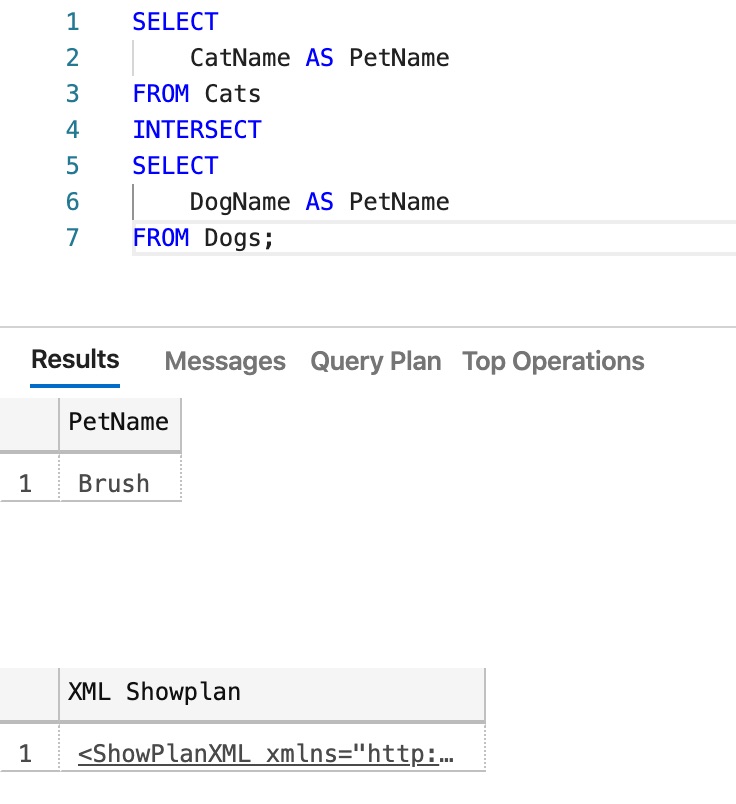
If you click this tab after getting the actual query plan, you’ll see the result of the query as well as the XML query plan (as shown in the above screenshot).
If you click the tab after getting the estimated plan, then you’ll only see the XML query plan.
You can click on the XML Showplan to open the XML document. Clicking it opens the XML document in a new tab.
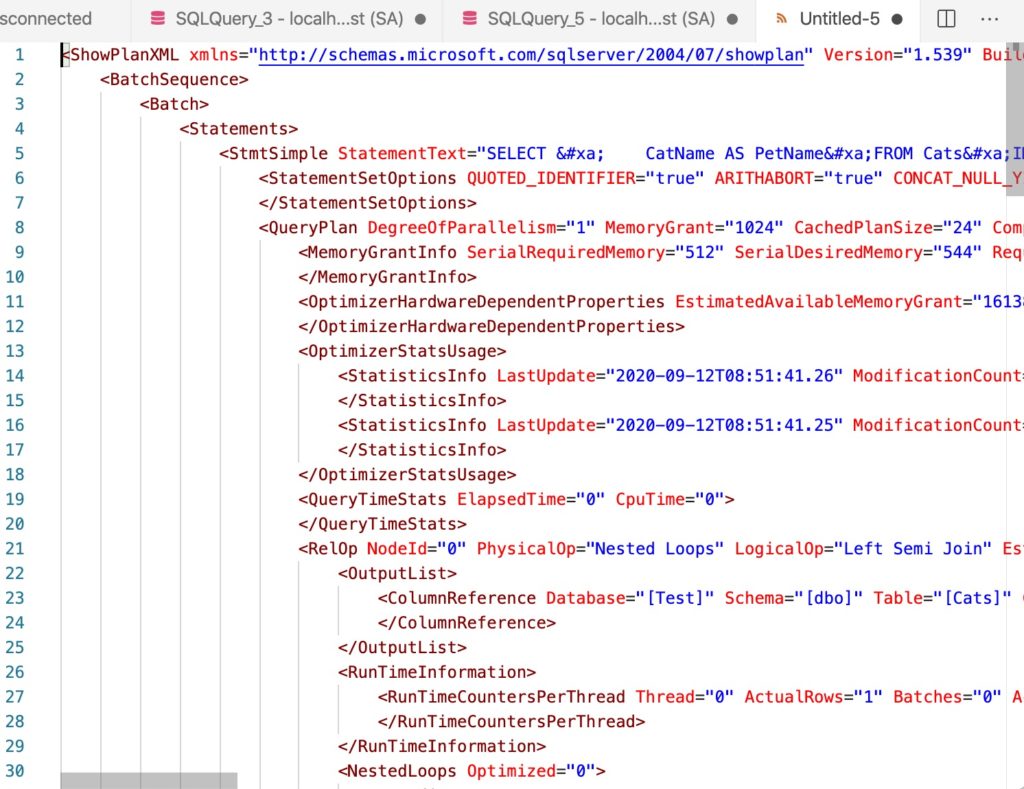
You can save this with a .sqlplan extension, then open it again later if required. When you open it, it will open as the graphical representation of the query plan.